As summer finally reveals its true glory here in the UK – are the markets beginning to warm up too? Owen from our investment committee provides a market and portfolio update…
 General Market Update – Summary
Up until the turn of the year, global markets in the main were continuing the “relief rally” that had gained traction as the effects of the Covid-19 pandemic abated. Things were looking more positive!
Having said this, since late 2021 markets have had a whirlwind of events to digest; rising energy costs, supply chain issues, ongoing COVID lockdowns and most recently the Ukraine conflict, have provided “turbo-boosters” for rising inflation. Too much inflation is the enemy of Central Banks. Global stock markets have reacted to the consequential monetary tightening by central banks (in the shape of rising interest rates) and general disquiet and negativity, by losing significant value since February.
Covid-19 – effects abating
Whilst there was something of a setback to markets with the new Omicron variant – it was fairly short-lived. Effectively the headline view is that lockdowns ought to be a thing of the past and we can return to a new “normal”, as we learn to ‘live with Covid-19’. That said, individual countries take differing approaches to dealing with Covid. China is a case in point, as it chooses the ‘lockdown’ option where it feels necessary. As the world’s workshop, this has had a dramatic effect on supply. When we then consider the lockdown of key ports in China (who knew that 7 of the 10 largest ports in the world are in China1 then it’s not difficult to see that Covid still affects us on many levels, other than infection!
Market sectors
The FTSE100 and UK indices generally remained “laggard(s)” until the middle of 2021, but then more money started to flow into UK-centric funds, as they were deemed cheap/undervalued. With a generally improving global market, the FTSE and smaller UK indices have had a few months “in the sun” over the last 9-12 months.
China raced ahead in the first quarter of 2021 but has cooled dramatically since then, with further lockdowns (alluded to above), a dramatic and unannounced tightening of legislation aimed at large tech firms in the summer of 2021 and an erosion of more of Hong Kong’s “independence” with the introduction of one-party candidates etc. representing issues that make China a bit of a conundrum; I think it would be fair to say that, whilst investors want to invest in China because of its present and future growth prospects, its governmental approach leaves investors wondering “what next”, which is certainly a barrier to investment and definitely plays a part in China-centric funds remaining down on previous highs.
The US indexes hit regular “highs” throughout 2021. However, since the turn of the year, with the inflation narrative gaining traction and corresponding increasing base rates affected by the Fed, Indexes started to reflect negative sentiment and we have seen significant drops of 15%+ in the DOW, S&P500 and NASDAQ2.
Europe had largely mirrored the US through 2021, but factors that are prescient for all economies PLUS a conflict in the middle of Europe itself have not been good for European indices/markets. When that conflict also highlights a non-sustainable energy policy with Russia, this only feeds into general negative sentiment, so we have seen a drop of around 15.8%2 since the beginning of January in the Eurostoxx50 index.
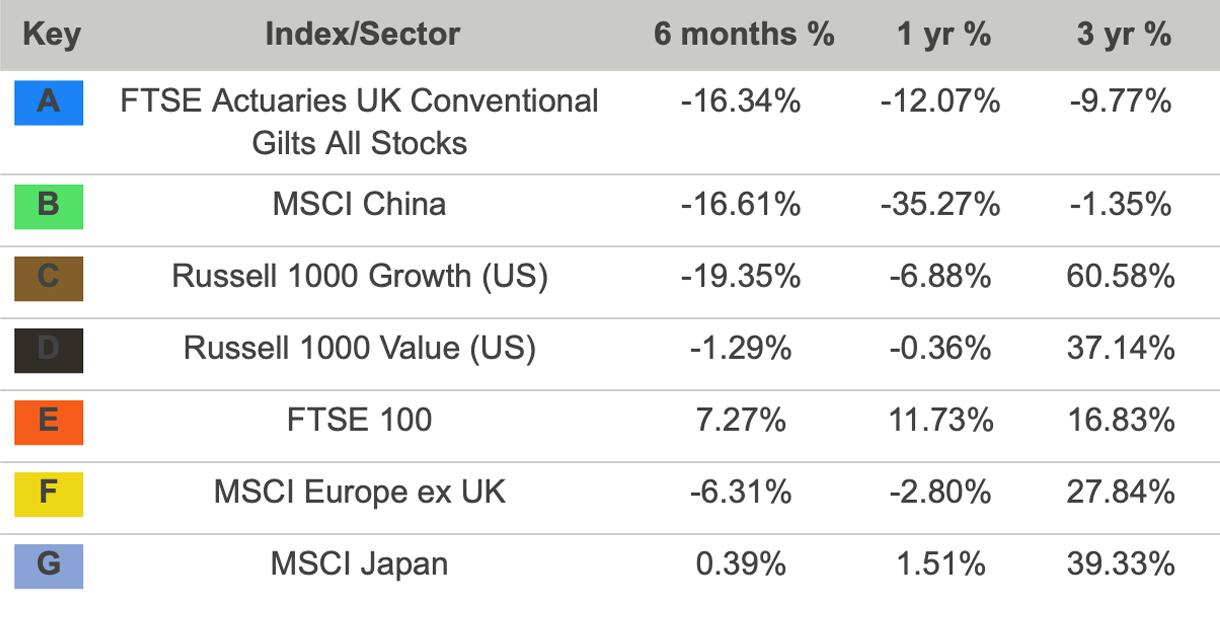
Turning to a specific sector – the Growth sector, it is this sector that has seen significant drops in value in a world where the majority of large indexes have dropped. Growth stocks have taken something of a pummelling. Whilst Growth stocks tend to outperform Value stocks over the long term, the prices of Growth stocks have been hit hard. The charts below include the US Russell 1000 Growth and US Russell 1000 Value indices to illustrate this point. (Value and Growth stocks exist worldwide but these US indices are illustrative of the general situation).
Growth vs Value stocks – what’s the difference?
| Growth stocks are shares in companies that are expected to grow faster (either by revenues or cash flows and definitely by profits) than the rest. As growth is the priority, companies reinvest earnings in themselves in order to expand, in the form of new workers, equipment, and acquisitions. Growth companies offer higher upside potential and therefore are inherently riskier than Value stocks and typically experience more volatility, as seen in recent months. Growth stocks experience price swings of greater magnitude but are well-suited for risk-tolerant investors with a longer time horizon. |
|---|
| Value stocks are shares in companies whose stock prices don't necessarily reflect their fundamental worth. As time goes on, the theory is that the market will properly recognize the company's value and the price will rise, and even if the stock doesn't appreciate, investors typically benefit from dividend payments, as some value companies pay out a chunk of their profits as dividends rather than reinvest them to grow their business. That said, some ‘Value’ stocks continually underperform and can be ‘cheap’ for a reason. Value stocks have a more limited upside potential and, therefore, can be safer investments than Growth stocks, albeit the longer-term growth prospects are more limited. |
Closer to home, the UK, in the shape of the FTSE100 – which is a more defensive index in its makeup (holding more Value stocks than Growth) has to some extent, maintained its performance from the third quarter of 2021 though it currently remains below its pre-pandemic high.
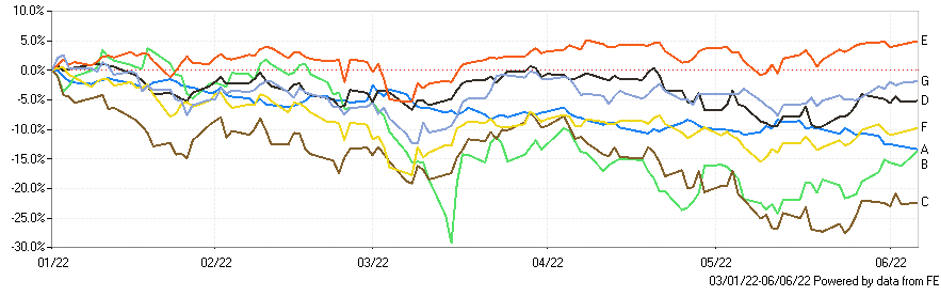
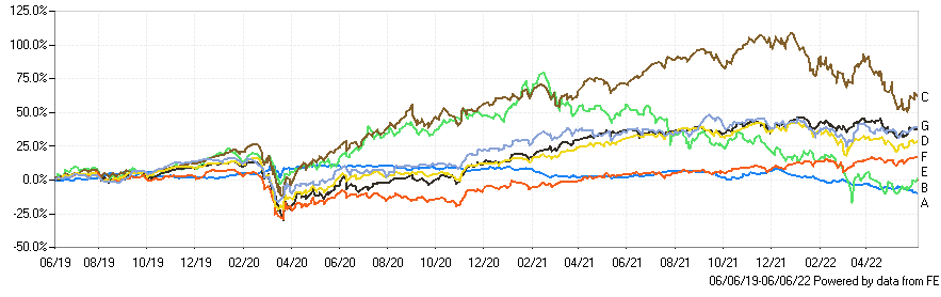
Below are two charts detailing returns over the last 6 months and three years summarised in the associated table. As you can see, even the traditionally “safe” Gilts market has been hit hard in the face of rising interest rates!
Markets Year to date 3rd January 2022 to 6rd June 2022
Markets last 3 years
Portfolios
This Growth/Value situation obviously affects our centralised client portfolios; as well as holding some Value stocks in our portfolios, we are very much believers in holding a good amount of Growth-oriented stocks in our client portfolios in order to provide longer-term performance against inflation. It is primarily this exposure that has seen the performance of our portfolios slip in the last 12 months. However, we would view the recent sell-off as a bump and potentially an opportunity for clients who subscribe to the “cyclical” nature of investment and are happy to invest “new” cash into funds/portfolios that only a few months ago were 15%-20% more expensive!
Investing is a long-term process, and it can be tempting to seek to sell out into cash until things stabilise and then repurchase investments again at a later date when the global picture is looking more positive. However, Legal & Medical’s view – as with all ‘black swan’ events (and we have seen plenty over the last two decades) – is that it is notoriously difficult to ‘time’ markets in this way. Looking back at the Iraq wars, the financial crisis and Covid-19 – to name just a few of those ‘black swan’ events from recent history, in each case the markets fell but soon recovered. Of course nothing can be guaranteed, but it is hoped history bears this out, and the same proves to be the case on this occasion.
As stated in the previous update(s)
“There is no right or wrong ‘time’ to invest, and no one can predict where the peaks and troughs lie now or in the future”.
To use the old mantra: “It is not “timing” the market, but “time in” the market that matters”.
The best course of action is to maintain composure and hold positions, particularly as portfolios are typically well-diversified.
Ref 1 World shipping council 2019
Ref 2 Yahoo Finance: DOW, S&P 500 , NASDAQ
Active Portfolios
You may need to scroll left and right if you’re viewing the table below on a small screen.
| Portfolio | 6 month performance | 1 year performance | 3 year performance | FE Risk Score |
|---|---|---|---|---|
| L&M Defensive Active | -11.17% | -7.21% | +6.99% | 37 |
| L&M Cautious Income | +2.50% | +4.45% | +13.40% | 46 |
| L&M Cautious Active | -13.16% | -9.32% | +13.15% | 50 |
| L&M Moderately Adventurous Active | -20.68% | -16.04% | +20.93% | 80 |
| L&M Adventurous Active | -21.69% | -16.75% | +22.52% | 90 |
| L&M Speculative Active | -24.24% | -21.40% | +20.97% | 105 |
Passive Portfolios
| Portfolio | 6 month performance | 1 year performance | 3 year performance | FE Risk Score |
|---|---|---|---|---|
| L&M Passive Defensive | -8.85% | -2.32% | +12.93% | 38 |
| L&M Passive Cautious | -7.00% | +1.29% | +25.35% | 51 |
| L&M Passive Moderately Adventurous | -5.95% | +2.62% | +32.38% | 66 |
Green & Positive Portfolios
| Portfolio | 6 month performance | 1 year performance | 3 year performance* | FE Risk Score |
|---|---|---|---|---|
| L&M Green & Positive Cautious | -8.00% | -0.22% | 61 | |
| L&M Green & Positive Moderately Adventurous | -9.81% | -0.60% | 74 | |
| L&M Green & Positive Adventurous | -12.61% | -2.07% | 88 | |
| L&M Green +Positive Speculative | -14.78% | -3.23% | 96 |
*3 year figures available summer 2022
Collective Portfolios
(for personally-held Investment Accounts)
| Portfolio | 6 month performance | 1 year performance | 3 year performance | FE Risk Score |
|---|---|---|---|---|
| L&M Cautious Collective | -9.83% | -5.45% | +16.09% | 49 |
| L&M Moderately Adventurous Collective | -15.38% | -10.82% | +20.85% | 68 |
We use FE Financial Express (relative risk) scores to map out the range of investment risk for a given portfolio or funds selected. Further information on this can be found in our “Legal & Medical Guide to Investment and Understanding Risk”. Please contact your individual adviser, should you wish to see a copy.